TikTok Shop Analytics Tips for Newbies and Professionals | Cross-Border Focus in 2025
Are you wondering why someone easily get huge orders in 3 days, while you get nothing even though you attempt a lot? The key is TikTok Shop Analytics, which plays a crucial role in the TikTok business.
In the traditional physical store model, we can see which products customers stop in front of, whether they buy them after trying them on, and what they complain about. TikTok Shop Analytics is our online version of the "monitoring room", turning virtual traffic into visible clues. Who is watching our videos but not placing an order? Why do customers quit in seconds? Are the cooperating influencers fooling us? TikTok Shop Analytics tells you the source of all this.
In this article, we'll talk about the ultimated TikTok Shop Analytics tips for beginners and experienced ones, covering analytics metrics, tools and more.
TikTok Shop Analytics Metrics
In the competitive ecosystem of TikTok Shop, data capabilities have become the core watershed that distinguishes mediocrity from excellence. Below, I will dismantle the key indicator system that affects the health of the store based on the platform's business logic and algorithm mechanism, helping us build a scientific operational decision-making framework.
User Behavior Trajectories: Decoding The Secrets Of Shopping Decisions
Whether the user is interested in the product after clicking it determines the final purchase rate. If the purchase rate is less than 10%, it means that the product or display method is not attractive. What’s even more fatal is the abandonment rate.
If the abandonment rate is more than 70%, like a customer turning around and leaving at the cash register, it is often caused by the tedious procedure, such as complex payment processes. The ultimate payment conversion rate is the ultimate test. If it is less than 2%, it means that there are serious loopholes in the entire conversion funnel.
The Truth About Transaction Value: Peeling Off The Disguise Of GMV
GMV is often used to show off performance, but it includes unpaid and refunded orders, just like restaurant reservation data is not equal to actual dining revenue.
What is more realistic is the actual sales amount - net income after deducting refunds. The average order value reveals the customer's consumption level, which varies greatly from category to category: fashion accessories are usually $8-15, and small appliances need to exceed $50. Beware of GMV bubbles.If the average order value continues to decline and the order volume does not increase, it may be a warning of profit erosion due to low-price promotions.
Platform Risk Control Red Line: The High Voltage Of Algorithm Supervision
TikTok uses strict indicators to monitor the service quality of sellers, just like traffic cameras capture violations: delayed fulfillment rate>4%, the store will be downgraded in search, just like the speed limit of vehicles.Seller cancellation rate>2.5%, the event registration qualification will be frozen.The most dangerous is the negative review rate, when 1-2 star negative reviews exceed 0.69% of the total reviews, the recommended traffic will be directly cut off. These thresholds are absolutely forbidden areas for platform algorithms.
Best TikTok Shop Analytics Tools
If you are running a TikTok Shop, or are just about to enter the market, then the following sentence is worth keeping in mind.If you choose the right products, you are halfway to success in sales; if you understand the data clearly, you can grasp the hot products firmly. But when it comes to actually doing it, many people will be drowned in the flood of information - which tools are reliable? Which functions are practical? Which investment is really worth it? These questions are exactly what I want to help you sort out one by one.
1. FindNiche TikTok Shop Analytics
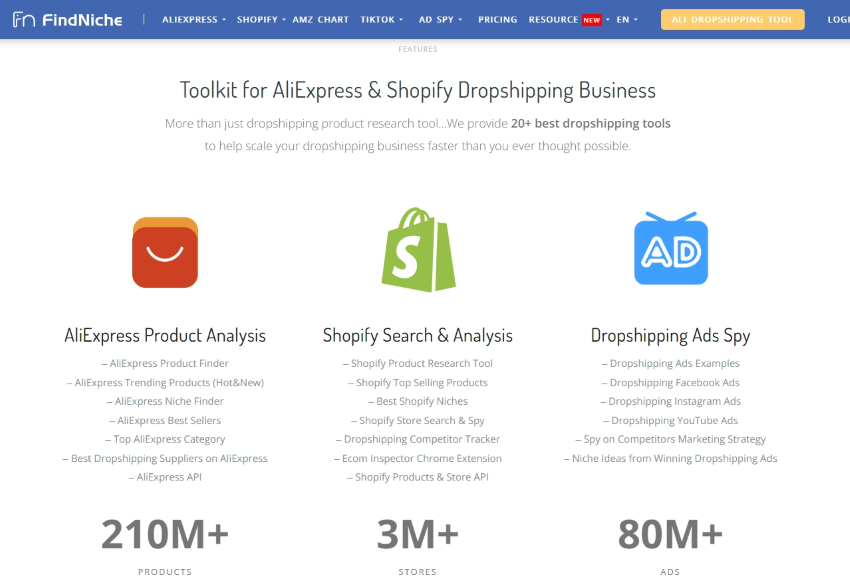
Among various TikTok analysis tools, FindNiche stands out due to its "cross-platform penetration". It features TikTok stores tracker, AliExpress supplers sourcing, Shopify independent sites and Facebook/TikTok advertising databases, forming a closed loop of product research.
Features:
● Multi-Platform Data Coverage
Deeply integrate product information from AliExpress and Shopify, and expand support for TikTok/Amazon advertising and product data tracking.
● Intelligent Product Selection And Recommendation
AI niche recommends potential products, and advanced screening systems locate hot selling products TikTok Shop.
● Competition And Profit Analysis Tools
Monitor competing stores to provide benchmarking learning, and display profit margins on multiple platforms to assist with pricing.
● Advertising Intelligence Database
Cross-platform tracking ads support one-click copying, verifying the closed loop of popular products and predicting product conversions.
● Efficiency Tool Integration
One-click import to Shopify, supporting image search and source matching.
Pros:
● Data Depth And Timeliness
AliExpress/Shopify/TikTok data are updated daily, providing product selection analysis within 30 days to reduce blind product selection.
● Cost-Effective
The basic version is free to try, and the monthly fee for the premium plan is lower than similar tools.$1 unlocks a 3-day fully functional trial.
● User Experience Optimization
The page introduction is friendly to newbies and provides direct links to competing stores to support lazy copying.
● Ecological Synergy Value
Covers the entire chain of product selection → supply → advertising → profit, suitable for Dropshipping and independent website sellers
Cons:
● Functional Permissions Are Clearly Layered
Core functions require membership to unlock
● Data Coverage Still Has Limits
Mainly based on AliExpress/Shopify, the data depth of Amazon, Walmart and other platforms is insufficient
● There Is A Learning Curve For Novices
Although the function is intuitive, advanced filtering items require experience to optimiz
2. Kalodata
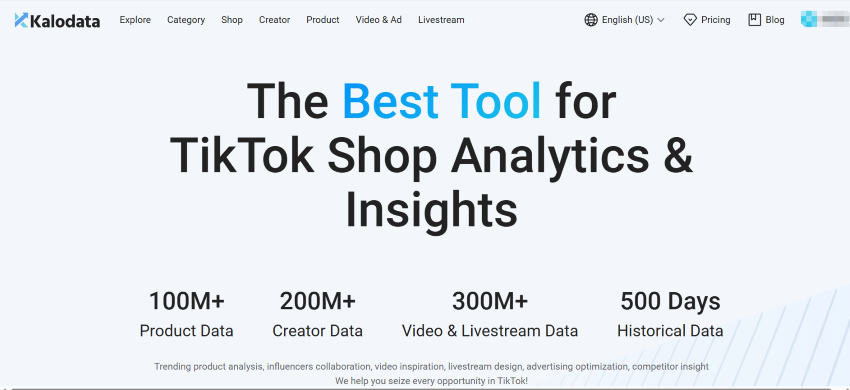
This is also a tool that provides TikTok Analytics, including functions such as hot product discovery, influencer networking, and live broadcast recording, which is suitable for sellers to improve the platform conversion rate.
Features:
● Ecological Depth Coverage
Covers product, influencer, live broadcast and short video data, and supports 180~500 days of historical data backtracking.
● Intelligent Product Selection And Hot-Selling Product Mining
Four-dimensional product selection strategy, real-time ranking tool integrated on the homepage.
● Talent Collaboration And Content Tools
Contains 200M+ expert data and supports content empowerment.
● Competitive Product And Advertising Analysis
Track partners, transaction structure, traffic strategy, and analyze advertising life cycle.
Pros:
● Practical-Oriented Functional Design
Provide a closed loop of product selection → content → delivery, adapting to TikTok’s e-commerce logic of “content triggers purchase”.
● Data Depth And Historical Review
Supports 180~500 days of historical data backtracking, which is better than most competing products.
Cons:
● Cost And Authority Tiering
It is strictly forbidden for multiple people to share an account. The monthly fee for the premium package is $399~$499, which is much higher than other competing products. The functions of the free version are extremely limited.
● Platform Uniqueness
It only focuses on the TikTok ecosystem and lacks cross-platform analysis capabilities such as Amazon and Shopify, making it unsuitable for omni-channel sellers.
● Learning And Usage Threshold
Advanced filtering items require certain operational experience, and novices can easily get lost in the data dimensions.
3. Glodastory
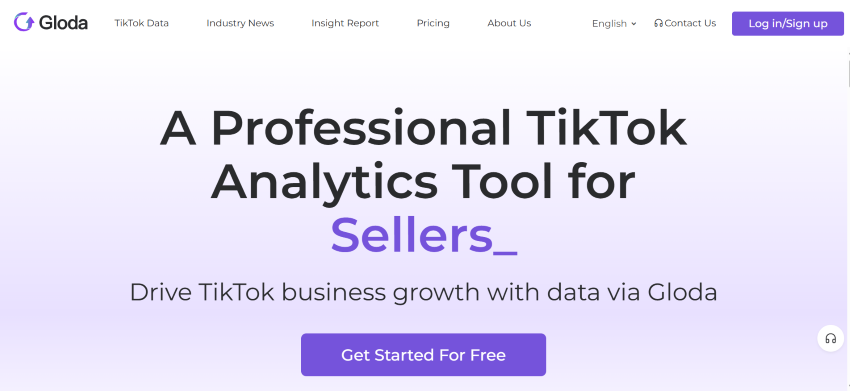
This is also one of the most popular TikTok Analytics tools, serving brands and strategy teams with multi-platform layouts, helping global product strategies and content delivery.
Features:
● Cross-platform data integration
TikTok Amazon + Douyin three-in-one product selection, in-depth coverage of subdivided categories.
● Intelligent product selection and hot-selling product mining
Listing tools provide multi-dimensional category screening and cross-platform product selection and sales optimization.
● Competitive products and market insights
The third-level category competition analysis locates low-competition tracks and empowers content marketing.
Pros:
● Cross-domain data fusion capability
Break the platform data silos, realize cross-platform comparison of TikTok, Amazon, and Douyin, and reduce the cost of trial and error in product selection.
● Practical-oriented closed-loop design
Provide a one-stop link of “discover blue ocean → benchmark competitors → generate content → contact experts”.
● Data depth and timeliness
The depth and timeliness of data segmentation and historical data backtracking support long-term trend prediction.
Cons:
● Advanced functional permission hierarchy
Core functions such as category screening and cross-platform analysis require payment. The free version only opens basic lists, and efficiency tools are limited to enterprise-level packages.
● Operation threshold and learning cost
The data comparison interface is complex, without guidance and easy to confuse, and the filter items are not friendly to novices.
● Data Dependence and Blind Spots
Relying on the platform's public data, the information of the blocked stores is missing; there is no supply chain data, and manual connection with suppliers is required.
How To Find TikTok Shop Hot Products
From Manual Guesswork To Algorithmic Precision: The Three-Layer Filter
In the TikTok Shop battlefield, hot products are the result of precise data algorithms. Traditional manual product selection is like looking for a needle in a haystack, while the essence of tool-driven is like a "demand heat detector" that locks in opportunities through three levels of screening:
- Demand Heat Scanning: Capturing the growth trends of TikTok search terms;
- Competitive Vacuum Positioning: Identifying “high demand, low supply” zones;
- Supply Chain Verification: Connecting to the supply stability index.
Tool-Driven Execution: Triangulating Profit, Demand & Competition
Taking FindNiche’s “AI Niche Product Recommendation” as an example, the system performs the following key actions:
- Cross-Platform Demand Comparison: Comparing the number of TikTok videos, Shopify shelf rate, and Amazon review growth to eliminate “single-platform false fire” products;
- Profit Penetration Calculation: Automatically calculating AliExpress purchase price, TikTok platform commission, and logistics costs to estimate net profit margins;
- Ad Popularity Warning: Scanning the frequency of creative updates on Facebook/TikTok to dynamically adjust competitive scores.The recommended products under this mechanism are essentially “low-risk explosive seeds” that have been triple-verified.
Pre-Empting 2025 Pitfalls: Secure "Low-Risk Explosive Seeds"
The "follow the trend" strategy that sellers relied on for survival in the past will face two major challenges in 2025:
- Time gap trap: When a product is on the TikTok hot list, the price of AliExpress may have risen by 30%-50%, compressing the profit margin;
- Homogeneity strangulation: Head sellers can quickly occupy traffic within 7 days through "advertising bombing + store matrix encirclement". Small and medium-sized sellers can monitor the "low competition, high growth" label in the TikTok advertising database through FindNiche, and then combine it with the supply chain source to finally seize the product opportunities with unsaturated demand, guaranteed supply and differentiated content.
How To Improve TikTok Shop Sales With Analytics
Diagnose & Optimize: Fixing Traffic-Conversion Gaps
The key to TikTok Shop sales growth lies in efficient conversion based on data and locking in the core issues reflected by the data. For example, the lack of price anchors or complex checkout processes. Content optimization must respond to changes in user behavior. Sellers can increase completion rates by reusing live highlights and adapt to the multi-platform distribution matrix.
Dynamic Efficiency: Ad Optimization & Precision Influencer Matching
Dynamic optimization determines the improvement of advertising efficiency: analyzing competitors' material strategies and changing the advertising time can optimize TikTok Shop Analytics indicators. In terms of the selection of influencers, the return on investment of mid-level influencers is higher than that of top influencers. Prioritize such influencers, vertical matches with a transaction rate of >85%, and most fan comments with purchase intentions.
Lifecycle Control: Data-Backed Explosive Product Management
Controlling the life cycle of a hit product requires synchronizing the supply chain and traffic. Sellers need to predict risks and verify products in three stages:
- Eliminate products with a natural traffic conversion rate of less than 0.5%;
- Test the price sensitivity of different groups of people;
- The inventory is 5 times the sales volume of the previous three days, and 3-5 scripts are updated every day to prevent fatigue. The key to competitiveness lies in speed. If you don’t have these capabilities, with FindNiche, you can compress the "diagnosis-strategy-verification" closed loop to 3 hours and quickly convert data into business results.
FAQs About TikTok Shop Analytics
1. TikTok Background Data And My Actual Order/Payment Amount Don't Match, What's Going On?
Check the same time period and status, and focus on the net sales and valid orders in the settlement report.
2. What To Do If TikTok Organic Traffic Suddenly Plummets?
Immediately check for violations, improve content quality and engagement, and experiment with innovative content formats.
3. What To Do If A Third-Party Data Tool Is Blocked By TikTok?
Prioritize the use of TikTok's official API access tools, or turn to the official Seller Central background data.
4. How Do I Get Access To TikTok Analytics?
If you have a TikTok Shop seller account or TikTok Business Account, you can access basic analytics in the back office or in the TikTok Shop Seller Center.
5. Are there Any Conversions On TikTok's Advertising Management Platform?
It's normal to understand attribution logic differences, focusing on trends rather than absolute numerical matching.
Conclusion
In the vibrant ecosystem of TikTok Shop, systematic data operations determine sustainable growth. TikTok Shop's analysis is more useful than post-event reports. Use tools to turn intuition into actionable means for product lifecycle and customer retention.
If you are struggling with product selection and sourcing, I recommend FindNiche; if you want to go deep into the TikTok single platform, I recommend Kalodata tools; if you have multi-platform expansion and brand strategy, I recommend Glodastory.
Companies that implement the "monitor-warn-iterate" system can ensure competitive advantage, while laggards can only rely on guesswork. Those who master the data will define the market.